
|
Debugging remotely using EclipseRuss Bateman |
|
It's assumed that the source code is already set up in an Eclipse project. This article also assumes you know a fair amount about the Eclipse debugger, reaching source code, etc.
Nevertheless, we'll tackle a common and perplexing problem in Eclipse... that of finding source code.
Depending on how large your project is and whether it uses classes out of JARs, etc., you may reach only the .class file in the debugger and not see the actual Java code. If it uses classes out of JARs for the build, then whether or not the source code is in your project, you'll likely get this:
To remedy this, click on the Attach Source button.
Click on the External Folder... button. Navigate to the top of the source tree for the class. If you don't have the source code in your project (or somewhere in your filesystem), then there's nothing you can do here. If, on the other hand, you do know where it is, navigate to it.
By top of the source tree is meant the subdirectory immediately above where the package name begins. Assume a source code path in a simple Eclipse project such as myproject/src/com/acme/xfire/XFire.java. The path to see in Location path: (in the dialog above) should be: /home/russ/dev/workspaces/fun-workspace/src. You should not include com, com/acme, etc.
Click OK. The content regions of the window enclosing the .class file you saw should change to become Java source.
Establish a breakpoint you know you'll hit (if anything actually runs) in the source code you see.
Your project runs as a server, maybe in Tomcat or some other container. Here, we're assuming that it's running separately rather than under Eclipse (as is done for smaller, simpler web application projects in Eclipse Web Tools Platform.
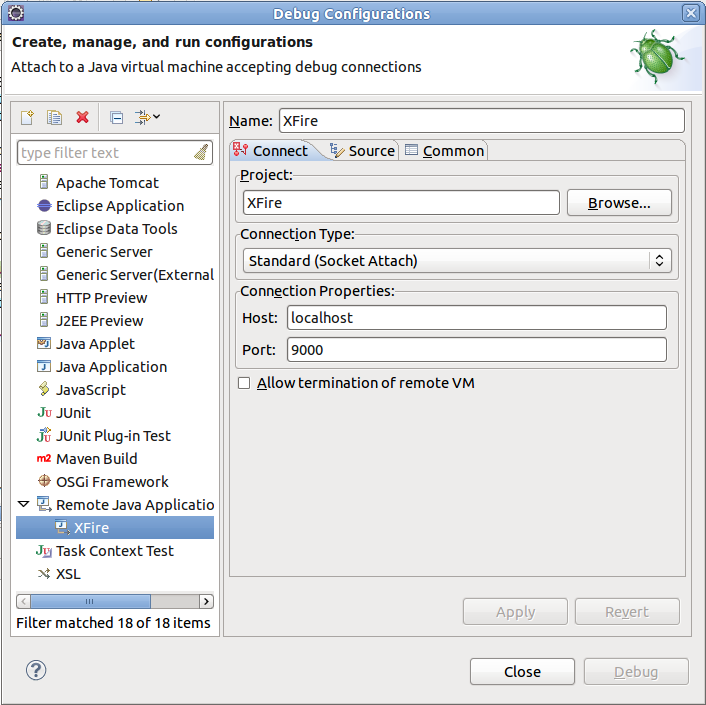
Right-click the project and choose Debug As -> Debug Configurations.... Then double-click Remote Java Application to create a new configuration. Fill it out. In order to do this you'll...
*The port is the challenge, though a minor one. You must know the port on which the service that is the application you plan to debug is running.
Note that your (remote) application should be running before you attempt to do this. Once you launch the debugger, you're typically going to have to wait a while: you should see the progress in the lower right corner of the Eclipse workbench.
This article doesn't cover the set-up of Eclipse, how to set breakpoints, create packages, source files, build JARs, etc. This all leads up to wanting to debug a project.
This article doesn't discuss how to create a service, or run it in Tomcat or another server container.
This article doesn't explain how, if necessary, to generate a complex user library containing the source code and JARs of a really big project. This is not important if your project isn't huge or often developed by engineers who don't themselves use Eclipse (i.e.: isn't specifically an Eclipse project).